Realistic ROI for digital product development: where TAM/SAM/SOM meets the financial forecast

Ever wonder why so many software projects fail? It has a lot to do with the inability to realistically estimate the realistic value versus the cost to reach the objective. It's a familiar story: a promising project gets green-lit with enthusiastic projections, only to drain budgets and deliver disappointing results. Here's the thing: most software development ROI calculations are like trying to navigate with two different maps of the same city. One map shows the big picture from satellite view (top-down market analysis), while the other shows street-level details (bottom-up financial forecasts). The problem? These maps rarely match up, leaving teams lost somewhere between ambitious dreams and harsh realities.
Think of ROI calculation like planning a restaurant
Imagine opening a restaurant. There are two ways to approach this:
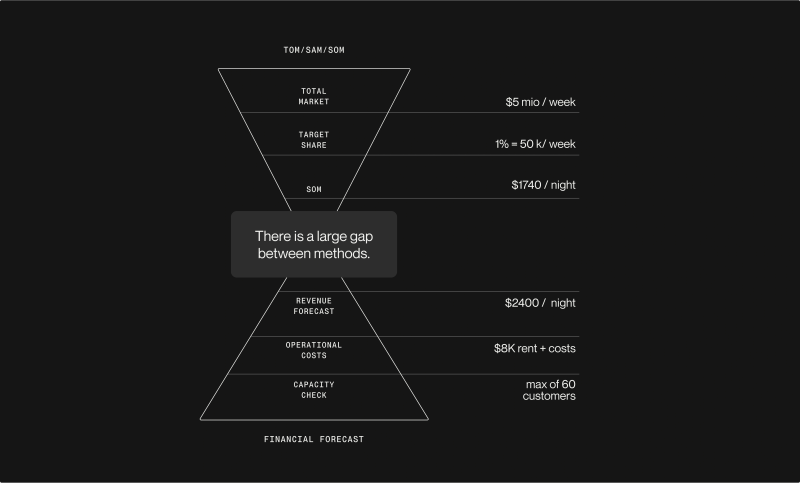
The satellite view approach (top-down): The approach looks at the entire city and thinks, "There are 100,000 people here, everyone eats out twice a week, average meal costs $25, so there's $5 million in weekly restaurant revenue available. If I capture just 1%, I'll make $50,000 per week!"
The street-level approach (bottom-up): The thinking goes, "My restaurant has 20 tables, each turns over 3 times during dinner service, average check is $40, so on a good night I'll make $2,400. With rent at $8,000/month and other costs..."
If these two calculations don't lead to roughly the same conclusion about whether the restaurant will succeed, something's wrong. The same principle applies to software development projects.
The big picture: connecting two different worlds
Most software ROI calculations fail because they treat market opportunity (TAM/SAM/SOM) and operational reality (financial forecasts) as separate exercises. It's like having the marketing team live in fantasy land while the finance team lives in doom-and-gloom territory.
The solution isn't more sophisticated modeling. It's making sure both approaches talk to each other. Think of it as ensuring the restaurant's "we could capture 1% of the market" conversation aligns with the "here's what we can actually serve each night" reality.
How it actually works: finding the common ground
Here's where most people get lost in spreadsheet complexity, but the actual method is surprisingly straightforward:
Step 1: Identify the bridge numbers. Both the top-down market analysis and the bottom-up financial forecast should share some common assumptions. For software projects, this usually means things like:
How many users/customers the organization will acquire over time
What the organization will charge them (pricing strategy)
How much it costs to acquire and serve each customer
Step 2: Test the assumptions against each other. If the top-down analysis says the team will capture 10,000 users in year two, but the bottom-up forecast assumes only 3,000 users can be handled with the planned infrastructure, a critical disconnect has surfaced.
Step 3: Calculate the overlap zone. This is where both approaches agree on what's possible. In our restaurant example, maybe the satellite view suggests 100 customers per night are within reach, but the street-level analysis shows only 60 can be served. The realistic target becomes 60 customers per night.
Why this actually matters: when dreams meet spreadsheets
The magic happens when the Serviceable Obtainable Market (SOM) - the realistic slice of market the organization can actually capture - produces revenue numbers that match what the operational plan can deliver.
Think about it this way: if the top-down analysis says the company will make $2 million in year two, but the bottom-up financial model shows $3 million will be spent to get there, the project isn't viable. It's an expensive learning experience waiting to happen.
This alignment isn't just about avoiding disasters. When both approaches point in the same direction, something powerful has surfaced: a realistic path from the organization's current position to where the market opportunity exists.
The advanced insight: time is the reality check
Here's what separates successful software projects from the graveyard of good intentions: they factor in time as a constraint, not just a variable.
A SOM calculation should include a timeline that matches the organization's financial runway. If the bottom-up analysis shows the money runs out in 18 months, but the top-down market analysis assumes 30 months are needed to reach profitability, a fundamental problem has surfaced before a single line of code has been written.
The real truth about financial modeling
Here's the misconception that kills projects: thinking that months should be spent perfecting the financial model because investors and VCs expect detailed projections, and believing these calculations have strong predictive value.
The reality? Diminishing returns on modeling arrive pretty quickly. An initial model won't predict the future accurately, but it serves as a crucial guide for making better decisions. It's like using GPS for navigation. The route might change based on traffic, but a starting direction is still needed.
The reason for this misconception is simple: investor presentations require detailed financial models, so teams assume these models need to be precisely accurate. But seasoned investors know these models are educated guesses designed to test thinking, not crystal balls.
A real example: the internal efficiency project
Let's say a company wants to build internal software to reduce customer service costs. Currently, the team handles 1,000 support tickets per month at $15 per ticket in staff time. That's $15,000 monthly in costs that could potentially be reduced.
Top-down thinking: "If we automate 60% of these tickets, we'll save $9,000 per month, or $108,000 annually."
Bottom-up reality: "Building this system will cost $150,000 and take 8 months. We'll need 2 months to train staff and work out bugs. So we're looking at $150,000 upfront for $54,000 in first-year savings (6 months of $9,000)."
When these numbers line up, the project pays for itself in about 20 months - if everything goes according to plan. Factor in the reality that software projects typically run 50% over budget and schedule (not at Eli5 obviously), and suddenly the payback period stretches to 30 months.
This doesn't necessarily kill the project, but it provides honest numbers for making an honest decision.
Making it work: the ROI reality check
The key insight is this: treat the ROI calculation like a conversation between an optimistic self and a pessimistic self. The optimistic self sees market opportunity and believes in efficient execution. The pessimistic self worries about costs, delays, and competitive realities.
When both voices agree that a project makes sense, the team has found something worth pursuing. When they disagree dramatically, the team has been saved from an expensive mistake.
The goal isn't perfect prediction. It's honest assessment. An ROI calculator should help the team ask better questions: What would have to be true for this project to succeed? Which assumptions are most critical? Where are we most likely to be wrong?
That's how an organization turns software development from a hopeful expense into a strategic investment with eyes wide open.
The first step to start your modernization journey
Software modernization and architectural rebuilds lie at the heart of Eli5. We solve complexity to deliver direct business value by focusing on pragmatic, cloud-native transitions.
Before you decide whether to wrap your legacy system, buy a new SaaS product, or use AI to build custom tools, you need total visibility into your current tech landscape.
Would you like to book a free brainstorm to discuss your legacy stack? It is the essential first step to turning your technical debt into a scalable, modular future.
 Floris Schoenmakers